Merry Christmas! It is a time for family, fun, and EPL midseason review! The soccer season is almost halfway through, and there have certainly been plenty of surprises so far. Certainly, there will be plenty more entertainment the rest of the season, but I spent some time this week scouring through stats to try and analyze what we have seen so far. A lot of what I looked at will be more tendency based, but some stats give more of an idea of team performance.

The graph above shows each team’s points and goal differential. The trend line gives an idea of how each team should be performing based on the league this season only. Teams above the trend line have outperformed what their goal differential would predict. Unsurprisingly, Leicester is the big overachiever so far this season, and this graph reflects that. Teams like Liverpool, Bournemouth, and Newcastle also seem to be outperforming their statistics, while Aston Villa, Everton, and Tottenham are doing worse than their stats would predict.

The graph above shows each team’s shot ratio compared to their opponents as well as their shots on target accuracy. The blue circles show how much a team shoots compared to the shots they concede. Arsenal, Liverpool, and Man City all significantly outshoot their opponents, while West Brom and Newcastle shoot barely over half as much as their opposition. The red bars indicate the percentage of a team’s shots that find the target. Tottenham, Man City, Newcastle, Palace, and Arsenal all hit the target with a large percentage of their shots, while Stoke, Chelsea, and Aston Villa hit the target the least often. Arsenal and City look the most impressive, managing to get off more shots and more accurate shots than their opponents.
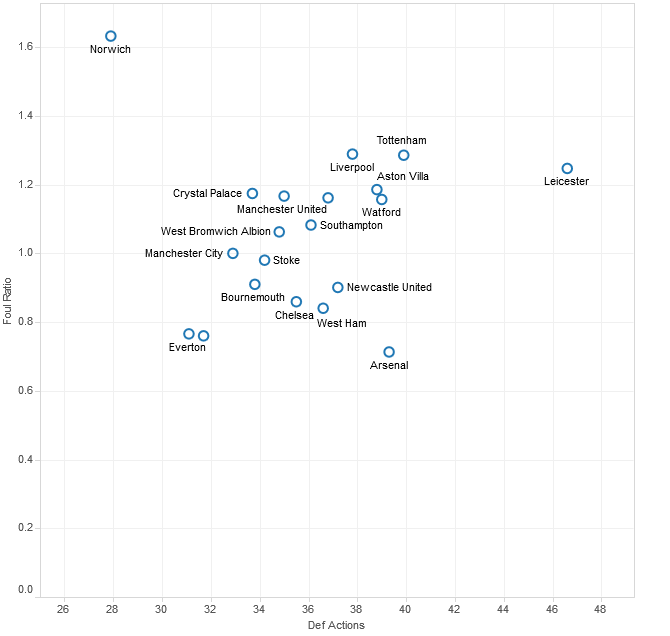
The next graph shows a team’s defensive actions (tackles and interceptions) as well as their foul ratio (fouls committed vs fouls received). Teams in the lower right of the graph commit a high number of defensive actions, and foul much less than their opponents. Arsenal makes nearly 40 defensive actions per game, but commit less that three-fourths of the fouls they receive. Leicester makes the most defensive actions at nearly 47 per game, though they commit about 20% more fouls than they receive. Norwich highlights the worse end of the defensive spectrum, making the least defensive actions (28) and committing the highest ratio of fouls (60% more than they receive).

The graph above shows how each team scores their goals (counter attacks, open play, and set pieces). What jumps out initially is that Everton and Watford score over 70% of their goals from open play and more establish possession. Everton leads the league at nearly 81%, showing how much Roberto Martinez has impacted their style of play. Mourinho’s effect on Chelsea is very evident as they have scored a league worst 43% of their goals from open play. Aston Villa leads the league in goals from set pieces at nearly 36%, while Swansea and Everton rank last with only about 7% of their goals coming from set plays. Newcastle is well ahead of the rest of the league with 16% of their goals coming from counter attacks, while several teams are yet to score a single goal from counters this season.
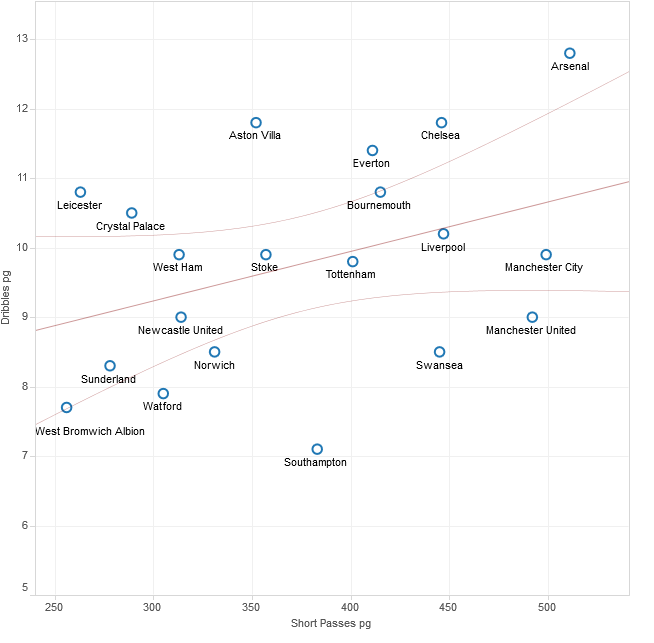
The next graph shows how often a team successfully dribbles compared to the number of short passes it attempts. Teams in the top right complete a large number of dribbles and attempt a high number of passes. These teams include Arsenal, Chelsea, Liverpool, and Man City. Teams in the lower left complete very few dribbles and lower numbers of passes. These teams include WBA, Watford, and Sunderland. The trend line shows the predicted amount of dribbles based on the number of passes a team attempts. Teams that dribble more than expected include Arsenal, Chelsea, Everton, Aston Villa, and Leicester. Teams that dribble less than expected are Manchester United, Swansea, Southampton, and Watford.

The final graph shows each team’s passing tendencies as far as how often they attempt long balls, crosses, and through balls. The ratios show how many short passes a team attempts for each different pass type. Higher ratios indicate a lower tendency for long balls etc, while lower ratios indicate a team attempts them more often. Arsenal attempts the lowest percentage of long balls and crosses, but attempts the highest ratio of through balls. West Brom, Leicester, and Watford attempt the highest percentage of long balls, while Arsenal, Manchester City, and Liverpool attempt the least. West Brom and Leicester also attempt high numbers of crosses, while Arsenal and Tottenham attempt the lowest. Surprisingly, Sunderland attempts a high frequency of through balls, while Manchester United attempts the lowest.
It has been a great EPL season so far, and the second half looks to be just as exciting. Merry Christmas and enjoy!
