It has certainly been an incredible World Cup so far. Lots of goals, some great performances, and a few heartbreaks (I still haven’t gotten over last night…). I have been compiling statistics through the first two group games looking for signs of teams playing styles and performance levels. Obviously, one can get a very good idea of a team’s playing style by watching them play, but there are also some statistical markers that give an idea of how a team plays. The two stats I looked at were:
- Defensive Aggression = The number of pass attempts a team allows before making a tackle or interception (PAPPA)
- Attacking Directness = The number of pass attempts a team makes before taking a shot (PPS)
- Shot Dominance = Ratio of a teams shots to shots conceded
For me, these two statistics give a very good idea of how a team approaches the game. For example, Ghana is a very direct, counter attacking team. This can be seen statistically by the fact that they allow a low number of pass attempts between pressing actions (tackle or interception), and have a low number of pass attempts between shots. On the other hand, Spain plays a high pressing defense, but a very patient offense as shown by their high number of pass attempts per shot, but low number of pass attempts allowed between pressing actions. A third example would be England. England was very content to drop deep, sit back, and let Italy and Uruguay pass the ball around (shown by their high PAPPA). Upon winning the ball, England was balanced between patient build up play and a more direct approach (shown by their mid-level PPS).
First, lets look at which teams were the most aggressive when defending.

The teams on the left side of the graph have lower Pass Attempts Per Pressing Action, meaning they press higher and quicker to win the ball back. Teams like Argentina, Uruguay, Brazil, Japan, and Nigeria all press the ball quickly to try and break up opposition attacks early. On the other end, South Korea, Portugal, and especially England appear to be more content to cede possession in the midfield and defend deeper. Based on England’s World Cup performance, once has to question whether the decision to give players like Pirlo and De Rossi so much time on the ball was their eventual undoing. Additionally, teams like Australia and the US who played very defensively in difficult groups appear at the right end of the chart. It is also worth noting that there is no “better” way to play, as I found no correlation between defensive aggression and the points a team earned.
Now on to attack style.
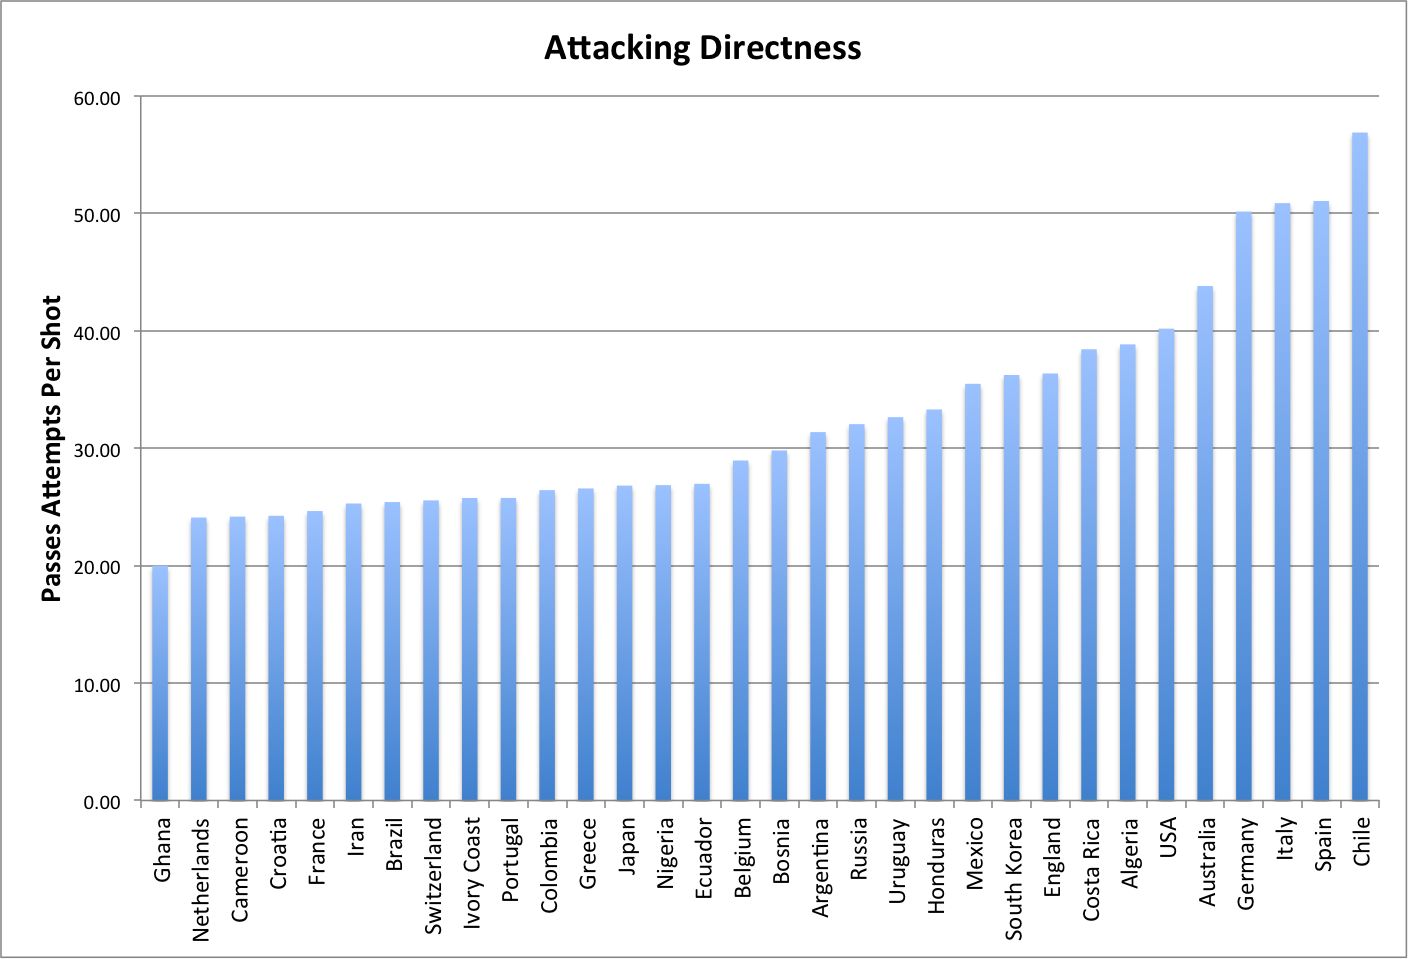
In this chart, the teams on the left attempted less passes per shot taken. Simply put, the teams on the left attack more directly. The want to attack quickly and with as few passes as possible. Teams like Cameroon, Ghana, Croatia, and France all want to win the ball back and counter their opponents quickly. Given that France, Ghana, and Croatia have scored 16 goals between them, it appears as though they are very successful in this strategy. On the flipside, teams like Spain, Italy, and Chile appear to prefer a much more patient attacking style. They want to string together a high number of passes and hope to tire a defense out before picking out the killer pass. This strategy has worked for teams like Chile and Germany, while Spain struggled to turn this style into goals. Like defensive aggression, there does not appear to be a “better” style of attack. I found no correlation to points earned, and teams on both end of the spectrum have found success in this year’s World Cup.
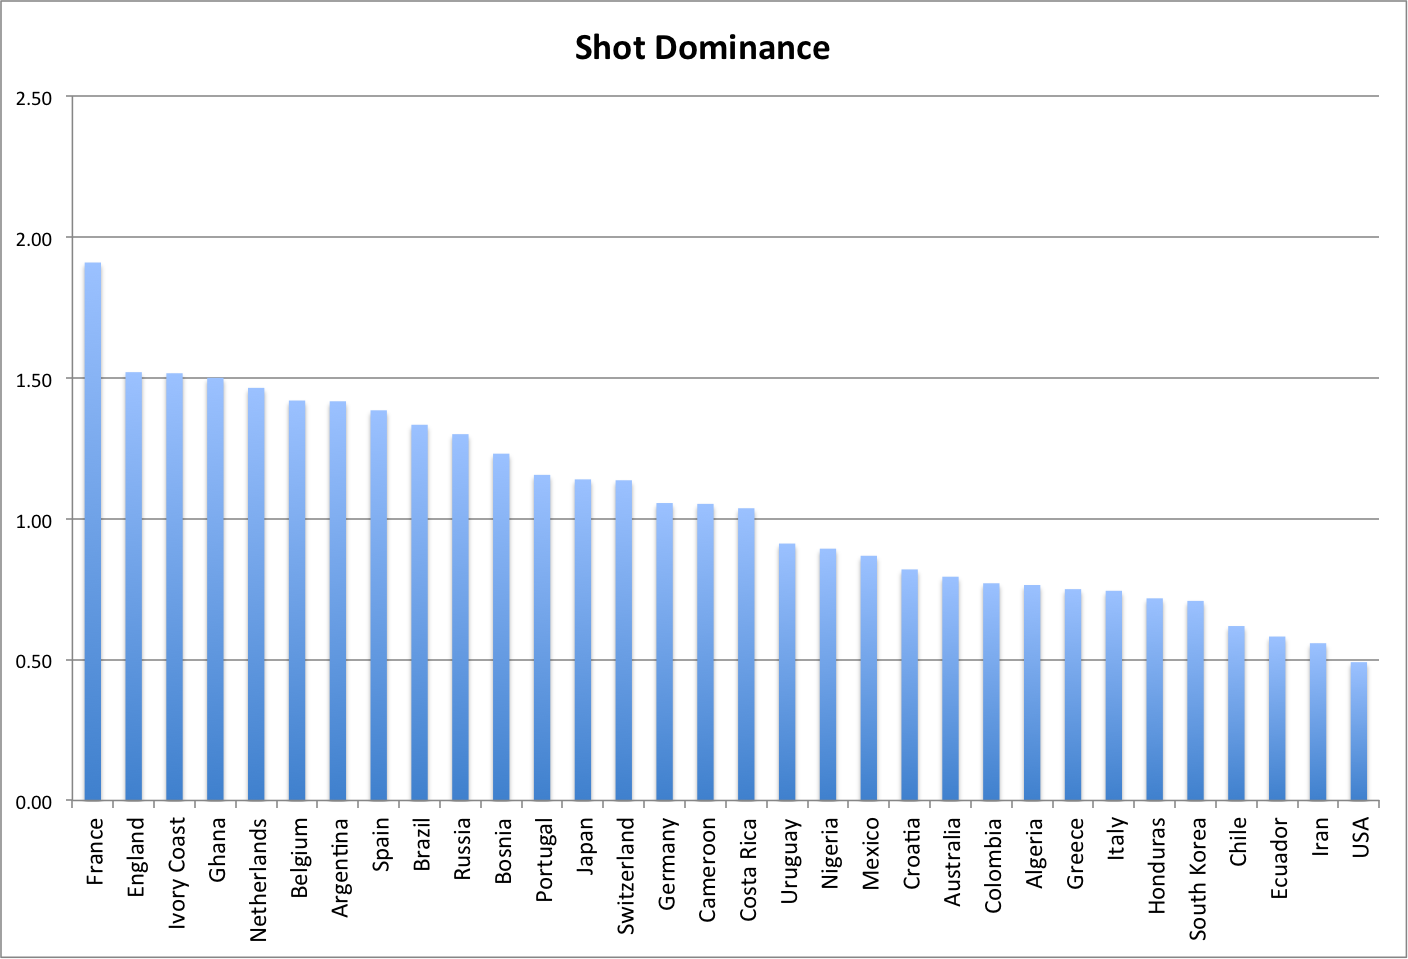
The chart above helps identify how many shots a team took compared to their opponents. A shot ratio of 1.0 would indicate that a team shot exactly the same number of shots as their opponent. The higher the ratio, the further left on the chart, the more the team out shot its opponent. From the chart, we can see that teams such as France, England, Ghana, and Netherlands out shot their opponents, while teams like Chile, Iran, and the USA were significantly outshot. It is worth noting that teams on both ends of the spectrum managed to advance to the knockout rounds.
Of course, these statistics give an idea of each team’s style through only 3 games, an incredibly small sample. There are several factors that could have contributed to these statistics other than a team’s preferred style of play, such as weather, opposition, injuries, etc. However, these statistics do help to give an idea of how a team prefers to attack its opposition, and how aggressive they are defensively.
