After working on my team ranking system for lacrosse, I decided to go back and work one up for basketball as well. I’ve always liked Dean Oliver’s Four Factors, so I thought I would take those and combine them to create my own offense and defense ratings for each ACC team. For those who are not familiar, Dean Oliver stated that a team’s success roughly boils down to four factors. They are:
- Shooting %
- Turnover %
- Rebound %
- Free Throw Rate – How many free throws per field goal attempt
I used the four factors for each ACC team’s offense and defense, and weighted them based on Dean Oliver’s findings. Then, I combined these statistics with a teams offensive or defensive rating (points per possession) to get a team’s offense and defense scores. The higher the score, the better the team’s offense or defense. Finally, I combined both scores to get a teams overall score.
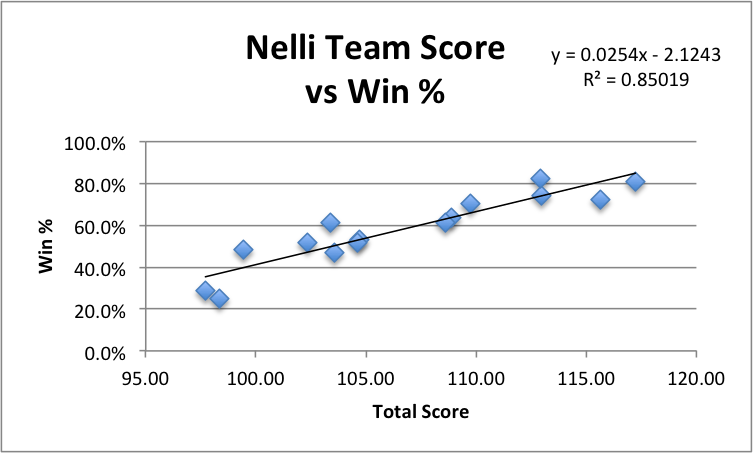
The numbers I found confirmed what I had already suspected, which is always a good thing. Duke, Pitt, and Syracuse topped the ACC in offense, while Virginia and Clemson were tops in team defense. When the two statistics were combined into an overall score, the top three teams in the conference were Virginia, Pitt, and Duke. As always, what good is a statistic if it doesn’t mean wins? Based on my research, I found that my defense score was slightly more correlated to winning that my offense score (by about 8%), but my total score was significantly correlated to winning (85%). Here are the rankings
| Team | Nelli Off Score | Nelli Def Score | Nelli Total Score |
| Virginia | 60.64 | 56.58 | 117.22 |
| Pittsburgh | 64.44 | 51.17 | 115.61 |
| Duke | 67.50 | 45.47 | 112.97 |
| Syracuse | 61.97 | 50.92 | 112.89 |
| North Carolina | 60.62 | 49.10 | 109.71 |
| Clemson | 55.47 | 53.40 | 108.86 |
| Florida State | 59.59 | 49.02 | 108.62 |
| Maryland | 55.44 | 49.24 | 104.68 |
| Miami (FL) | 55.48 | 49.15 | 104.63 |
| Notre Dame | 59.37 | 44.18 | 103.55 |
| NC State | 59.08 | 44.32 | 103.40 |
| Wake Forest | 57.00 | 45.35 | 102.34 |
| Georgia Tech | 52.69 | 46.75 | 99.44 |
| Boston College | 59.39 | 38.97 | 98.36 |
| Virginia Tech | 51.14 | 46.57 | 97.71 |
And here are the results of my linear regression showing correlation between my Nelli Team Score and win %.